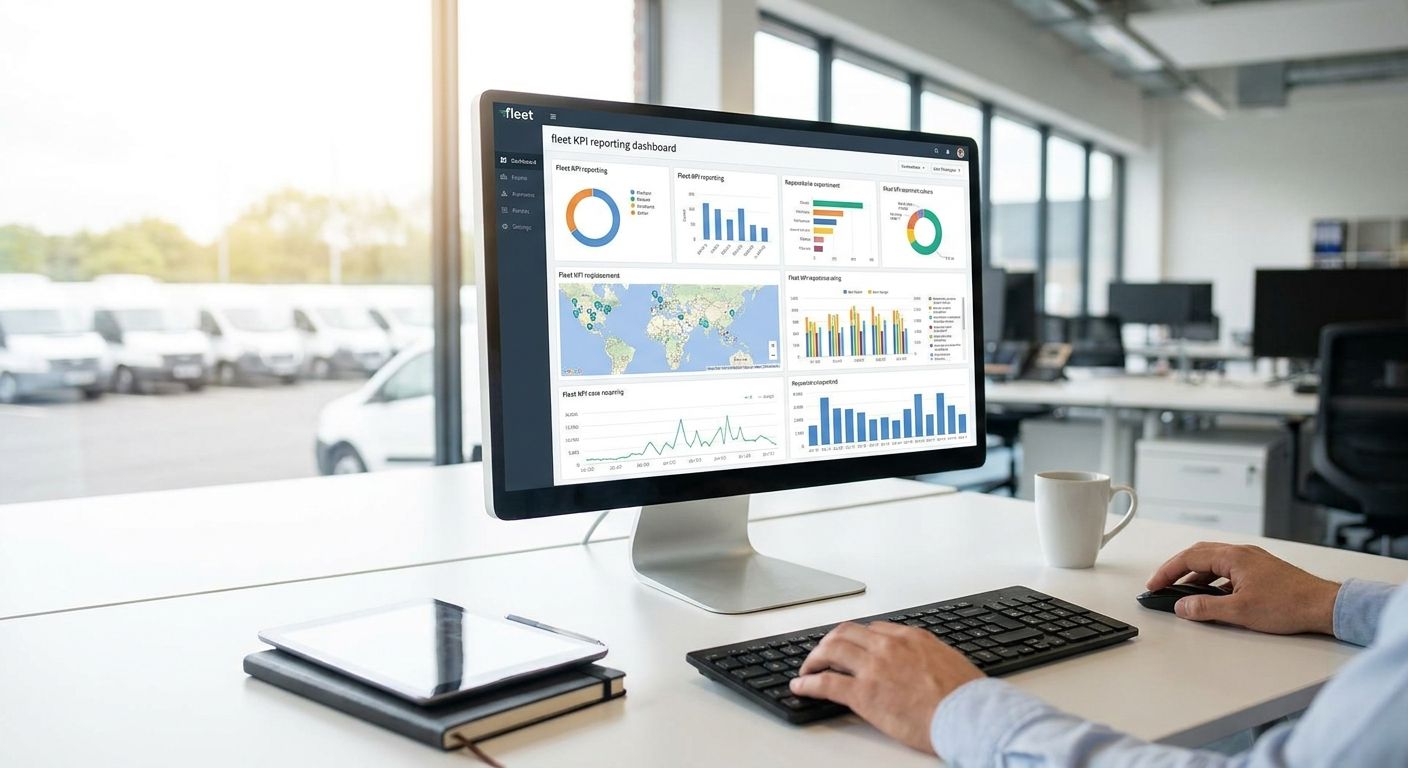
A fleet KPI reporting dashboard pulls cost-per-mile, idling time, driver risk scores and compliance status out of six spreadsheets and puts them on one screen a fleet manager can actually read before 9am. This guide ranks the dashboard types worth paying for in 2026, tells you which one fits a five-van operation versus a 200-vehicle council fleet, and flags the build-your-own option most SMEs should skip.
- An all-in-one fleet KPI reporting dashboard beats spreadsheets for cost-per-mile and driver risk tracking in 2026 - buy it.
- ROI-focused dashboards pay for themselves inside a year by exposing idling and fuel waste across the fleet.
- Carbon and ESG reporting dashboards are now expected reading for council and public-sector fleet tenders.
- Skip a custom BI build unless you already run a data team - most SMEs need the packaged dashboard, not a project.
Why this matters
Most fleet managers already collect the data. GPS pings, fuel card transactions, driver behaviour scores, MOT dates - it all exists somewhere. The problem in 2026 is that it lives in four different systems, and nobody has time to reconcile them before a board meeting or an insurance renewal.
A proper fleet KPI reporting dashboard fixes that by pulling everything into one view with the metrics that actually move the needle: cost per mile, idling minutes, harsh-braking events, licence and CPC expiry dates. Crystal Ball builds this reporting layer directly into its vehicle tracking and dash cam platform, so the dashboard reflects the same data used for insurance claims and compliance audits, not a separate export that goes stale.
Get the dashboard wrong and you're back to spreadsheets by March. Get it right and it becomes the first thing you open each morning.
How this list was ranked
Each dashboard type below was judged against five criteria fleet managers raise most often when comparing telematics reporting: breadth of data (does it cover fuel, driver behaviour and compliance in one view, or just location), real-time versus end-of-day reporting, export and API options for finance teams, dedicated compliance modules for things like Driver CPC and DVSA earned recognition, and setup time for a fleet running 10 to 100 vehicles.
None of these are abstract preferences. A dashboard that only shows vehicle location tells you nothing about why fuel spend jumped 12% last quarter. One that buries driver risk scores three clicks deep won't get checked before a claim goes to an insurer. The ranking below reflects what actually gets used daily, not what looks impressive in a sales demo.
The ranked list of fleet KPI dashboard types
1. All-in-one telematics KPI dashboard - the safe pick
This is the default choice for most SMEs and local government fleets in 2026: one dashboard combining vehicle location, utilisation, fuel spend and driver score. It works because a fleet manager checking on 15 vans doesn't want five logins. Setup typically runs alongside a standard vehicle tracking rollout, so there's no separate reporting project to manage. Verdict: Buy for any fleet without a dedicated data team.
2. ROI and cost-per-mile dashboard - the finance director's favourite
This dashboard type strips everything back to money: cost per mile, cost per vehicle, fuel spend against mileage, and depreciation trend lines finance teams can drop straight into a board pack. It matters because most fleet managers can quote total spend but not which vehicles are actually losing money. A guide on how to calculate ROI on fleet management software walks through the payback maths in more detail. Verdict: Buy if budget scrutiny is the main pressure this year.
3. Fuel and idling cost dashboard - the fuel-cost killer
Fuel remains the single largest variable cost on most fleets, and idling time is the easiest one to fix once it's visible. This dashboard type isolates fuel card spend, idling minutes per vehicle, and route efficiency against planned journeys. Fleet managers who never look at idling data are usually the ones surprised by their next fuel bill. Verdict: Buy for any fleet running diesel or mixed vehicles in 2026.
4. Driver behaviour and accident-risk dashboard - the insurance-premium lever
Harsh braking, speeding events and cornering scores feed straight into insurance renewal conversations. A dashboard that scores drivers individually, not just fleet-wide, gives managers something concrete to raise in a one-to-one rather than a vague "drive more carefully" memo. This is the category insurers ask about most at renewal. Verdict: Buy for any fleet with more than one at-fault claim in the last policy year.
5. Carbon and ESG reporting dashboard - the compliance dashboard council fleets can't skip
ESG reporting has moved from nice-to-have to a tender requirement for local government and public-sector contracts in 2026. This dashboard tracks CO2 output by vehicle and route, and a dedicated guide on fleet carbon reporting for ESG compliance covers what a council fleet needs to have ready before an audit. Verdict: Buy for council and public-sector fleets, Consider for private SMEs not yet facing tender requirements.
6. Compliance and driver-hours dashboard - the DVSA audit-proofer
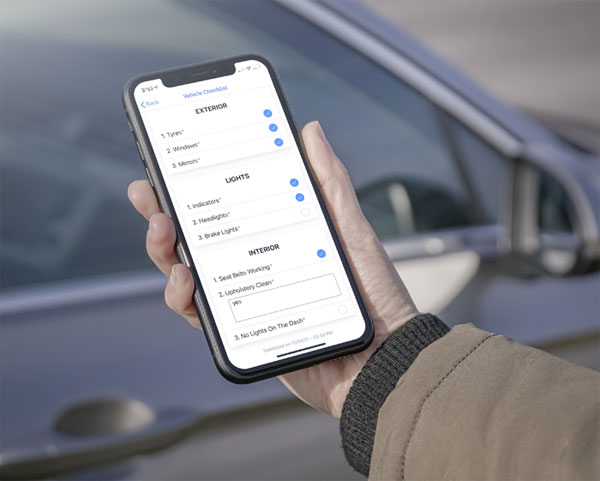
Driver CPC requires 35 hours of periodic training every 5 years, and a compliance dashboard is the only sane way to track expiry dates across a driver roster of any size. Add licence checks, MOT dates and defect reports to the same screen and audit prep stops being a fire drill. Verdict: Buy for any HGV or PSV operator subject to earned recognition checks.
7. Custom API and BI-integrated dashboard - the wildcard
Some fleets pipe telematics data into Power BI or a warehouse and build their own KPI views on top. It's genuinely powerful if you already run a data team, but it turns a reporting task into an ongoing engineering project for everyone else. Most fleets running under 100 vehicles don't have the headcount to maintain it. Verdict: Skip unless you already have a dedicated analyst.


Fleet KPI dashboard comparison table
| Dashboard type | Best for | Real-time data | Setup effort | Verdict |
|---|---|---|---|---|
| All-in-one telematics | General SME and council fleets | Yes | Low | Buy |
| ROI / cost-per-mile | Finance-led budget reviews | End of day | Low | Buy |
| Fuel and idling | Diesel and mixed fleets | Yes | Low | Buy |
| Driver behaviour | Insurance renewal, high-claim fleets | Yes | Medium | Buy |
| Carbon / ESG | Council and public-sector tenders | End of day | Medium | Buy for public sector |
| Compliance / driver-hours | HGV and PSV operators | Daily | Medium | Buy |
| Custom API/BI | Fleets with an in-house data team | Depends on build | High | Skip for most SMEs |
How to choose a dashboard provider
- Confirm it uses the same data as your tracking hardware - a dashboard fed by a separate export always lags the real fleet by a day or more.
- Check compliance modules are built in, not bolted on - CPC expiry, MOT dates and defect reports should sit on the same screen as fuel and mileage.
- Ask what a smaller fleet looks like on the platform - a guide to fleet management software for small businesses is a useful check before committing to a platform built for 500-vehicle operators.
FAQ
What is a fleet KPI reporting dashboard?
A fleet KPI reporting dashboard is a single screen showing the metrics a fleet manager tracks daily: cost per mile, fuel spend, idling time, driver risk scores and compliance dates. It replaces separate spreadsheets and exports pulled from tracking, fuel card and HR systems.
What's the best fleet KPI dashboard for a small fleet in 2026?
An all-in-one telematics dashboard covering location, fuel and driver score in one view is the best fit for fleets under 50 vehicles in 2026. It avoids the setup overhead of separate ESG or custom BI modules a small fleet doesn't need yet.
Is a driver behaviour dashboard worth it for insurance purposes?
Yes, a driver behaviour dashboard is worth it if your fleet has had more than one at-fault claim in the last policy year. Insurers respond to documented harsh-braking and speeding data far more than a verbal assurance that drivers have been spoken to.
How much does a fleet KPI dashboard cost?
Cost depends on whether the dashboard is bundled with vehicle tracking or bought as a standalone tool - Thatcham-approved hardware that feeds these dashboards starts around £248 for an S7 tracker in 2026. Standalone dashboard-only pricing varies by vehicle count and should be quoted directly.
Do council fleets need a carbon or ESG reporting dashboard?
Most local government fleets need ESG reporting in 2026 because carbon output is increasingly a tender requirement, not an optional extra. A dedicated carbon dashboard tracks CO2 by vehicle and route so the data is ready before an audit rather than assembled after a request.
Can a fleet KPI dashboard track Driver CPC compliance?
Yes, a compliance-focused dashboard tracks Driver CPC hours against the 35-hour requirement every 5 years alongside licence checks and MOT dates. This turns DVSA audit prep into a daily glance rather than a scramble before an earned recognition review.
Is a custom BI dashboard better than a packaged fleet KPI tool?
For most fleets under 100 vehicles, no - a packaged dashboard gets you reporting on day one, while a custom BI build turns reporting into an ongoing engineering project. Custom builds only make sense when a fleet already runs a dedicated data or analytics team.
How often should fleet KPI data be reviewed?
Daily for fuel, idling and driver risk metrics, weekly for cost-per-mile trends, and monthly for compliance and ESG reporting. Fleets that only check KPIs at renewal time miss the fuel and idling waste that compounds over a quarter.
One last thing
The dashboard most fleet managers skip until it's too late is the driver behaviour one - not because it's expensive, but because nobody wants to see the harsh-braking count next to their own name on the roster. Turn it on anyway; the fleets that review it monthly are the ones that walk into an insurance renewal in 2026 with a number to negotiate with, not just a claims history.