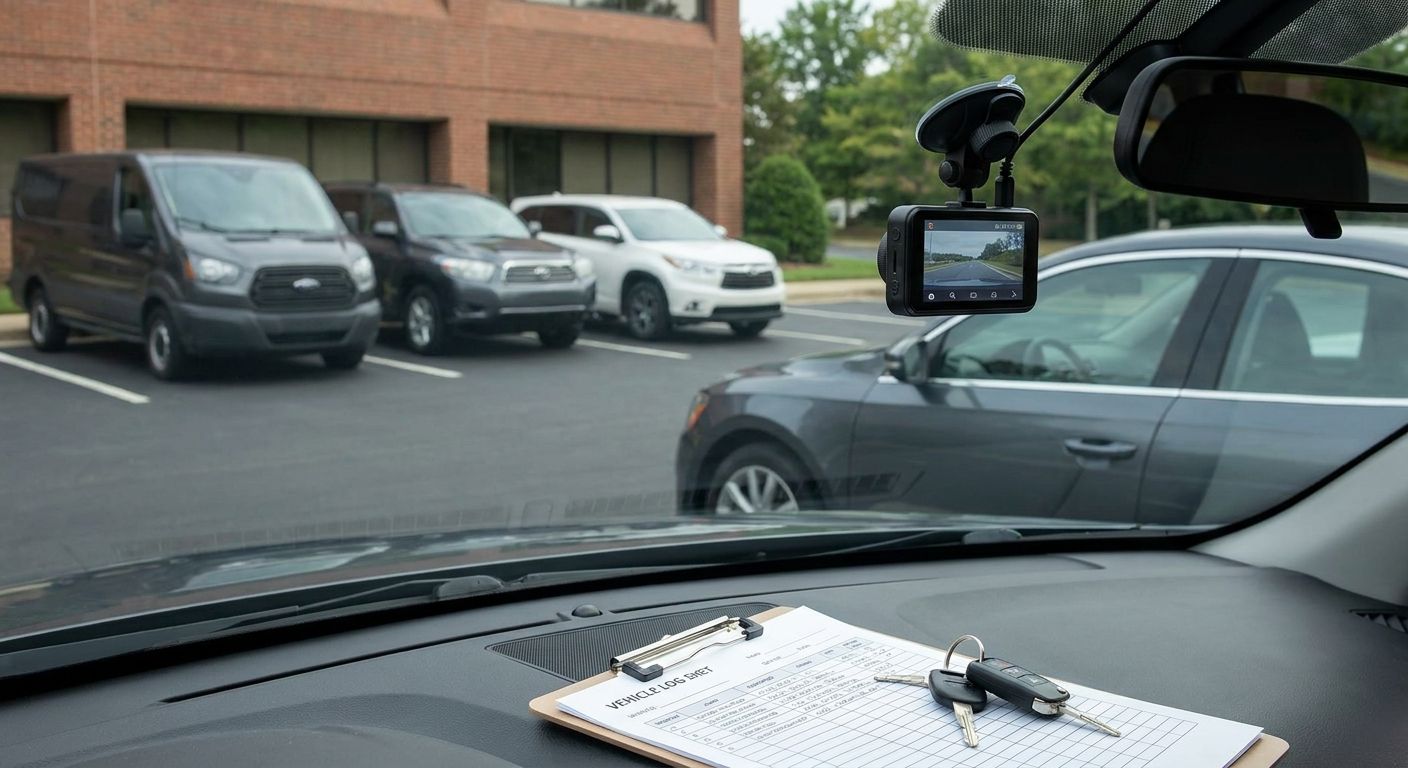
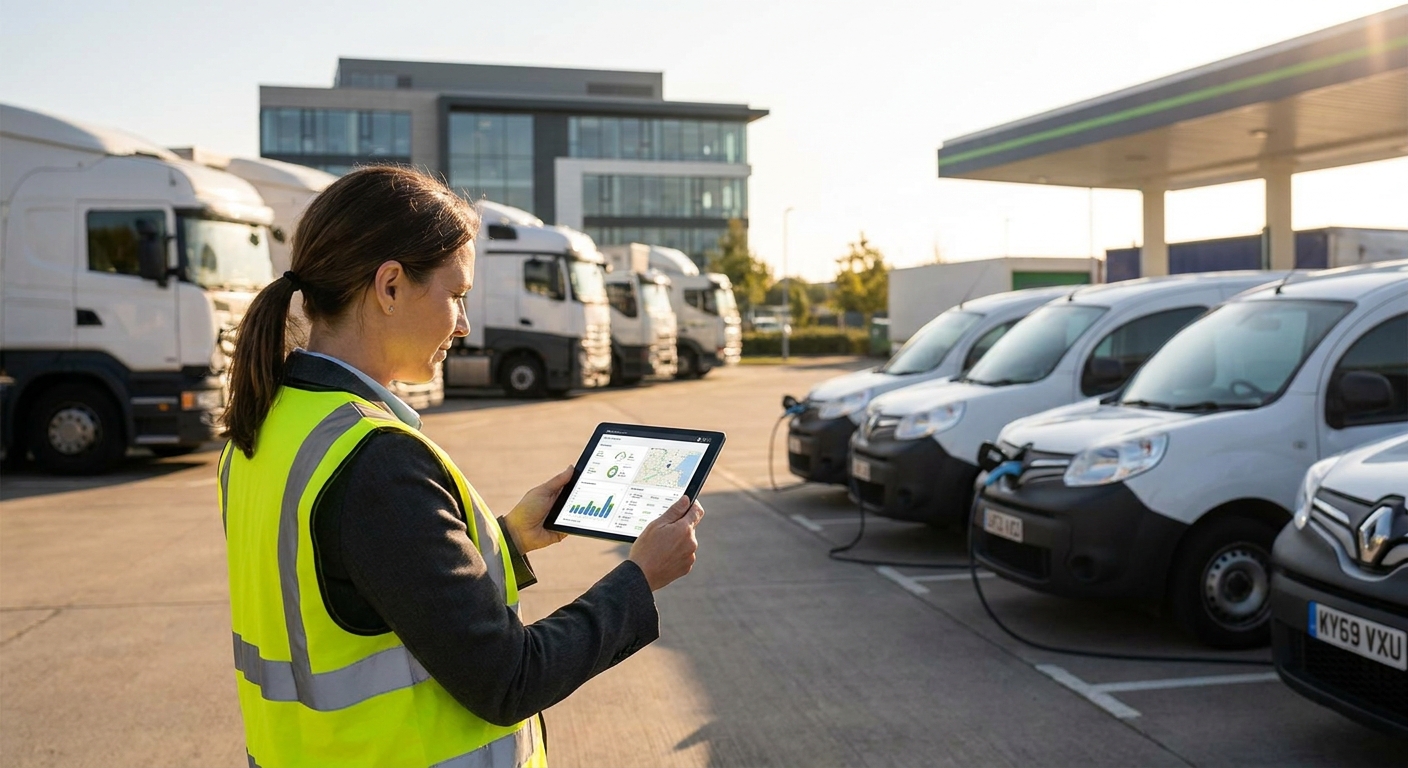
Running diesel vans and electric vans on the same telematics platform means tracking two different clocks: fuel receipts and charge sessions, mpg and kWh/mile, service intervals built around engine hours versus battery cycles. Crystal Ball fleet tracking data shows the split works when you stop treating the mixed fleet as one vehicle type with two badges.
- How to manage a mixed EV and diesel fleet with telematics starts with separate KPIs for range, charge time and fuel spend on one dashboard.
- Crystal Ball fleet tracking flags EV range anxiety and diesel idling from the same platform — set alerts for both, not one.
- Geofencing depot charge points matters as much as tracking diesel refuelling stops for mixed fleet telematics in 2026.
- Driver behaviour scoring needs recalibrating per powertrain — harsh acceleration drains diesel mpg and EV range at different rates.
Why this matters
Fleets adding EVs in 2026 aren't retiring diesel overnight — most are running both for years while charging infrastructure and van ranges catch up to route requirements. A telematics platform built for one fuel type breaks down fast: mpg reports mean nothing for an EV, and a single driver score that ignores regenerative braking will unfairly penalise your electric drivers or flatter your diesel ones.
The Crystal Ball platform pulls both vehicle types into one view, but the setup work is on you. Get the baselines wrong in month one and you'll spend the rest of 2026 arguing with drivers about scores that don't reflect reality.
What you'll need
- A telematics platform that ingests OBD and CAN bus data from both ICE and EV vehicles
- Current mileage, fuel, and (if available) charging cost records for the last 3-6 months
- A list of depot and public charge point locations to geofence
- Manufacturer range figures for each EV model in the fleet, plus real-world range logged over at least 20 journeys
- Buy-in from drivers on why scoring differs by vehicle type — this avoids disputes later
The steps
1. Audit your current fleet mix and set separate baselines
List every vehicle by powertrain, then pull three months of mileage and fuel or energy cost data for each. Diesel vans in mixed fleets typically return 35-45 mpg depending on route type; EVs typically fall short of manufacturer range figures by 10-20% in cold weather or heavy load. Set your baseline from actual logged data, not brochure numbers — this is the single most common reason mixed-fleet comparisons look skewed against EVs.
Common mistake: comparing EV range against summer test-cycle figures instead of your own winter driving data.
2. Standardise your telematics platform across both powertrains
Running one system for diesel and a separate EV-only app doubles admin and splits your data. A single fleet tracking platform that reads both fuel and charge data means one login, one report, one driver league table adjusted for vehicle type. This is the step most fleets skip in year one and regret by year two when reconciling two data sources eats a day a month.
Common mistake: keeping a legacy diesel-only telematics box installed just in case — it fragments your data and doubles hardware costs for no benefit.
3. Build geofences around charge points and fuel stations
Set a geofence with roughly a 100-150 metre radius around depot charge points and any regular fuel stops. This lets you track dwell time at chargers the same way you'd track a fuel stop, flagging vehicles that sit plugged in for 3+ hours when a 30-45 minute rapid charge session was all that was needed. For cutting fuel and energy costs with tracking data, geofenced charge and fuel data is the input that makes cost-per-mile comparisons honest.
Common mistake: geofencing fuel stations but not charge points, so EV downtime goes untracked while diesel downtime gets flagged.
4. Recalibrate driver behaviour scoring per powertrain
Harsh acceleration and heavy braking cost a diesel van fuel; the same events cost an EV less because regenerative braking recovers some energy. A single driving-style score applied to both fuel types will make your best EV drivers look average and your best diesel drivers look reckless. Split the scoring weightings — braking events count less against EV drivers, idling events count more against diesel drivers since EVs don't idle-burn fuel at standstill.
Common mistake: applying one universal harsh-braking threshold to both vehicle types and wondering why EV drivers top every league table by default.
5. Track range and charge status alongside fuel and mileage
Build a daily dashboard view showing remaining range or fuel percentage against the day's planned route. Set an alert at 20% battery or a quarter tank so dispatch can reroute before a vehicle runs short mid-shift. This single change cuts the number of stranded-vehicle calls fleet managers report as their most disruptive mixed-fleet problem in 2026.
Common mistake: using the same low-fuel alert threshold percentage for both — EVs need earlier warning because finding a working rapid charger takes longer than finding a fuel station.
6. Set maintenance schedules by powertrain, not by mileage alone
Diesel service intervals run on mileage and engine hours; EV servicing is lighter but battery health checks and brake inspections (which wear slower due to regen braking) need their own schedule. Pull service due dates from telematics odometer and engine-hour data for diesel, and set a separate calendar-based check for EVs even on lower annual mileage.
Common mistake: scheduling EV services on the same mileage interval as diesel, missing battery health checks because the vehicle hasn't done enough miles yet.
7. Report cost-per-mile separately, then blend for total fleet TCO
Run two cost-per-mile figures — one for diesel (fuel, AdBlue, servicing), one for EV (electricity, servicing, any charge point access fees) — before combining into a blended fleet total. Reporting only the blended number hides which powertrain is actually saving money on your specific routes in 2026, and that's the number that should drive your next vehicle order.
Common mistake: blending cost-per-mile from day one, which masks whether your EVs are actually cheaper to run on your routes or just look cheaper because fuel prices spiked that quarter.


Troubleshooting
- EV range readings don't match manufacturer claims — log real-world range over 20+ journeys and reset your baseline; cold weather and load routinely cut EV range by 10-20%.
- Diesel idling alerts don't apply to EV pre-conditioning — exclude pre-conditioning windows (cabin heating while plugged in) from idling penalties, since it doesn't burn fuel or waste driving time.
- Drivers gaming charge point dwell time — set a dwell alert once charge reaches 90%+ so vehicles aren't parked occupying a charger longer than needed.
- Mixed maintenance schedules causing missed services — separate the service calendar by powertrain rather than relying on one mileage trigger for both.
- Cost-per-mile comparisons look unfair to EVs — check you're including diesel's AdBlue and higher servicing costs, not just pump price, before comparing to electricity cost.
- One driver league table causing complaints — split leaderboards by powertrain, or weight scoring so regen braking doesn't automatically put every EV driver at the top.
Tools and resources
- A unified telematics dashboard, benchmarked against the options in best telematics systems for logistics companies
- Geofencing tools for both charge points and fuel stations
- Separate cost-per-mile reporting templates for diesel and EV
- Driver scoring weighted by powertrain, not a single universal scale
- A maintenance calendar split by mileage (diesel) and time-based checks (EV)
What to do next
Once the split reporting is running cleanly for 90 days, use that data to decide your next vehicle order rather than guessing. If you're scaling past a handful of EVs, read how to scale a fleet tracking rollout from 10 to 100 vehicles before you add a second EV model or a third depot charging setup — the rollout mistakes compound fast once you're past 20 vehicles.
FAQ
What's the best telematics system for a mixed EV and diesel fleet?
The best system ingests both OBD/CAN bus fuel data and EV charge/battery data into one dashboard rather than running two separate platforms. Crystal Ball fleet tracking covers both vehicle types under one login in 2026, which cuts admin time versus running parallel systems.
Is fleet tracking different for electric vans vs diesel vans?
Yes — EV tracking adds range, charge status and charge point dwell time on top of the location and mileage data diesel tracking already covers. Driver behaviour scoring also needs separate weighting because regenerative braking changes how harsh braking affects energy use.
How do you compare fuel cost data between EV and diesel vehicles?
Run cost-per-mile separately for each powertrain first — diesel fuel plus AdBlue and servicing against EV electricity plus servicing — then blend into one fleet total. Comparing blended figures from day one hides which powertrain is actually cheaper on your specific routes.
Can one dashboard show both diesel mpg and EV kWh/mile?
Yes, a unified telematics platform can display both metrics side by side without forcing a single unit of measurement. Keep them as separate columns rather than converting to one figure, since converting hides real efficiency differences.
How much does mixed fleet telematics cost in 2026?
Cost depends on hardware choice, vehicle count, and whether you need insurance-approved Thatcham tracking or standard GPS units — get a quote based on your actual fleet mix rather than a per-vehicle average. Mixed fleets sometimes need different hardware tiers for high-value EVs versus standard diesel vans.
Do EVs need different driver behaviour scoring than diesel vehicles?
Yes — EVs recover energy through regenerative braking, so a universal harsh-braking threshold unfairly favours EV drivers over diesel drivers. Reweight the scoring model per powertrain so league tables reflect actual driving risk, not just vehicle type.
How do you set up geofencing for EV charge points?
Draw a geofence with roughly a 100-150 metre radius around each depot charger and set dwell-time alerts once charge passes 90%. This flags vehicles occupying a charger longer than needed, the same way a fuel-stop geofence flags a long diesel refuelling stop.
What's the biggest mistake when running mixed EV/diesel fleets?
Applying one set of KPIs, one driver score, and one maintenance schedule to both powertrains. Diesel and EV vehicles wear differently, refuel differently, and drive differently — telematics only works when the data is split before it's reported.
One last thing
The fleets that get the mixed-model comparison wrong almost always do it at the reporting stage, not the tracking stage — the data comes in fine, it's the single blended KPI that misleads. Split every report by powertrain for at least two full quarters in 2026 before you trust a combined fleet average enough to base a vehicle order on it.